
Key Takeaways
The best B2B lead generation metrics connect four layers:
- Activity
- Engagement
- Lead quality
- Pipeline and revenue impact
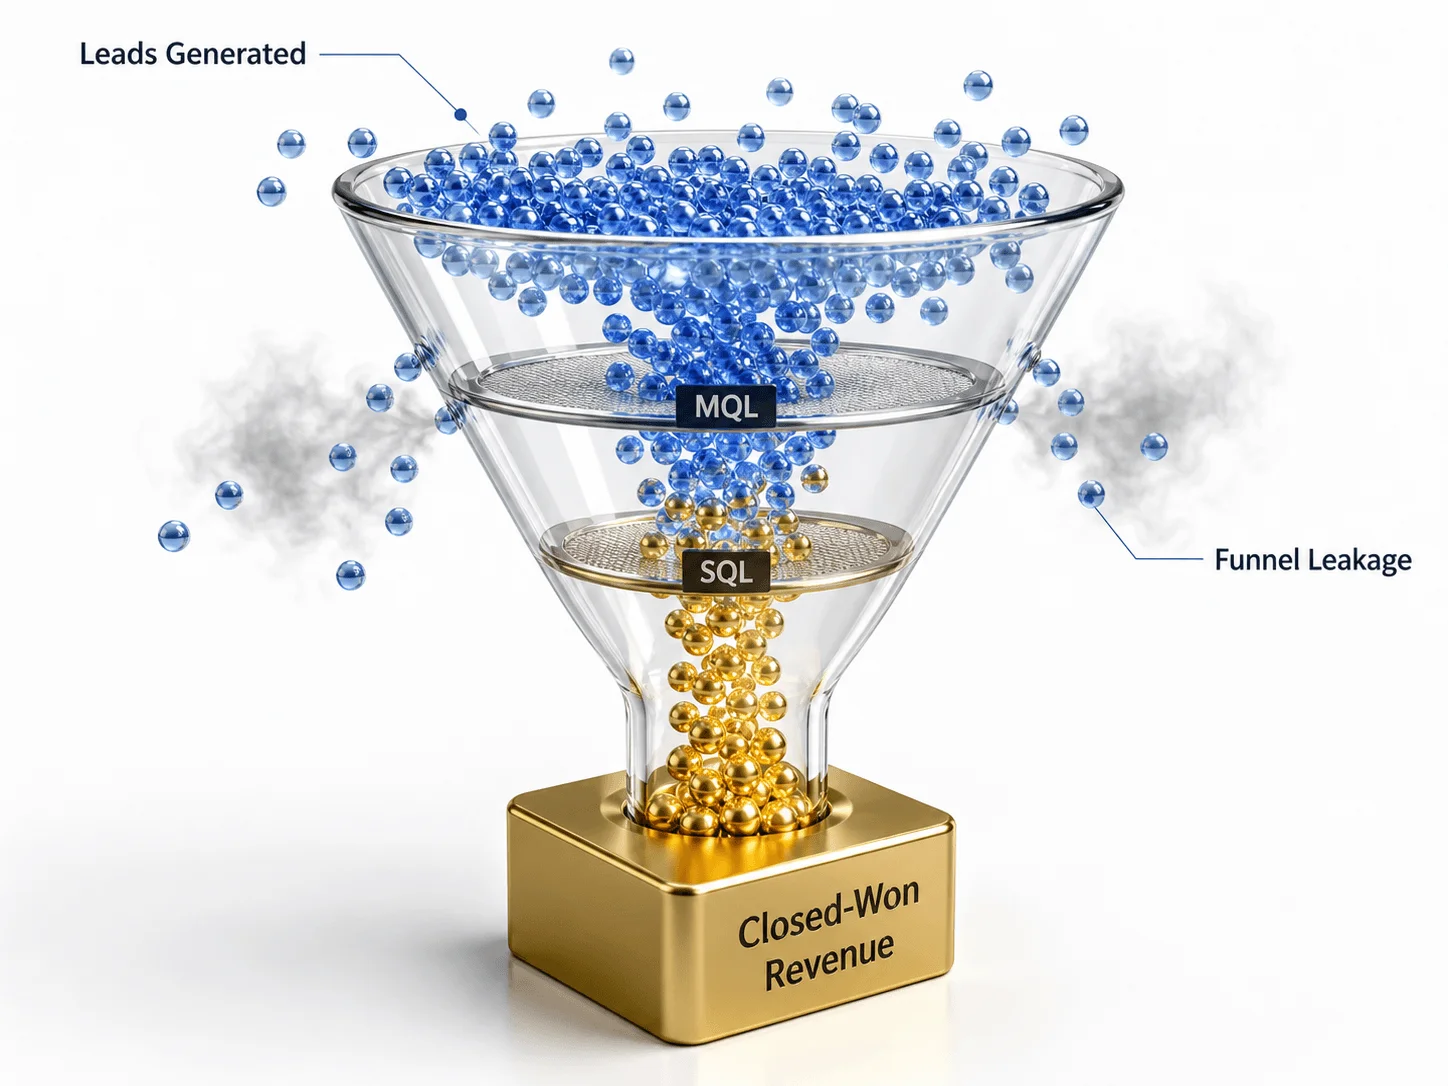
If your dashboard stops at leads generated, it is incomplete. Modern B2B teams need to track whether those leads become SQLs, sales-accepted opportunities, pipeline, and closed-won revenue. MQL-to-SQL conversion is often treated as one of the most important handoff metrics because it shows whether marketing is generating leads that sales actually accepts as pipeline-worthy.
What are lead generation KPIs?
Lead generation KPIs are measurable indicators that show how effectively a company attracts, qualifies, and converts potential buyers into sales opportunities.
In B2B, lead generation KPIs usually cover:
- Website and content engagement
- Form submissions
- MQL creation
- SDR activity
- Meetings booked
- SQL conversion
- Opportunity creation
- Pipeline value
- Customer acquisition cost
- Revenue contribution
The goal is not to track every possible metric. The goal is to track the metrics that explain where the funnel is working, where it is leaking, and whether lead generation is creating real business outcomes.
Why lead generation KPIs matter
Lead generation KPIs matter because they prevent teams from managing the funnel by opinion.
Without the right metrics, teams argue:
- Marketing says lead volume is up.
- Sales says lead quality is poor.
- SDRs say prospects are not responding.
- RevOps says attribution is messy.
- Leadership says pipeline is still short.
A strong KPI system creates shared visibility.
It helps answer:
- Which channels create qualified leads?
- Which campaigns produce SQLs?
- Which SDR activities lead to real meetings?
- Which meetings become opportunities?
- Which opportunities become revenue?
- Which segments are worth scaling?
- Which sources create low-quality pipeline?
The key is to separate vanity metrics from decision metrics.
A vanity metric looks good in a slide. A decision metric tells you what to fix.
The 26 essential lead generation KPIs
1. Website visitors
Website visitors measure how many people visit your site over a defined period.
Why it matters:
Website traffic is often the top of the lead generation funnel. It shows whether SEO, paid media, social, referral, and content distribution are driving market attention.
But traffic alone is not enough.
High traffic with low conversion may mean:
- Wrong audience
- Weak landing pages
- Poor offer alignment
- Low commercial intent
- Unclear CTAs
Best use:
Track visitors by source, page type, ICP relevance, and conversion path.
2. Traffic-to-lead conversion rate
Traffic-to-lead conversion rate measures the percentage of website visitors who become leads.
Formula:
Traffic-to-lead conversion rate = leads generated / website visitors x 100
Why it matters:
This tells you whether your website is converting attention into identifiable demand.
A low rate may indicate:
- Weak CTAs
- Poor form placement
- Low-intent traffic
- Misaligned landing page copy
- No clear next step
- Offer friction
The fix:
Segment by page type. A blog post, comparison page, service page, and demo page should not be judged by the same standard.
3. Leads generated
Leads generated measures the number of contacts captured through forms, chat, events, webinars, downloads, inbound requests, or outbound engagement.
Why it matters:
Lead volume is useful as a basic production metric.
But it should never be the primary success metric by itself.
A lead is only valuable if it has potential to become a qualified opportunity.
4. Lead source
Lead source identifies where a lead came from.
Common lead sources include:
- Organic search
- Paid search
- Paid social
- Direct traffic
- Referral
- Email marketing
- Webinar
- Event
- Partner
- Cold outbound
- Content syndication
- Review site
Why it matters:
Source quality varies widely.
A high-volume source may produce poor SQL conversion. A lower-volume source may produce better pipeline.
The fix:
Track lead source through the full funnel, not just at creation.
5. Cost per lead
Cost per lead, or CPL, measures how much it costs to generate one lead.
Formula:
CPL = campaign spend / number of leads generated
Why it matters:
CPL helps evaluate campaign efficiency.
But CPL can be misleading in B2B.
A low CPL is not useful if the leads do not convert. A higher CPL may be acceptable if the leads become qualified pipeline.
The better question:
What is the cost per qualified opportunity or cost per pipeline dollar?
6. Marketing qualified leads
Marketing qualified leads, or MQLs, are leads that meet marketing-defined criteria showing potential buying interest.
MQL criteria may include:
- Firmographic fit
- Page visits
- Form submission
- Content engagement
- Webinar attendance
- Lead score
- Intent signal
- Company size
- Job title
Why it matters:
MQLs are useful for prioritization. They are not revenue by themselves.
The risk:
Many teams over-celebrate MQL volume while ignoring whether sales accepts those leads.
7. MQL rate
MQL rate measures the percentage of leads that become MQLs.
Formula:
MQL rate = MQLs / total leads x 100
Why it matters:
This helps evaluate lead quality at the marketing qualification layer.
A low MQL rate may indicate poor targeting or weak offer quality.
A very high MQL rate may mean your threshold is too loose.
8. Sales accepted leads
Sales accepted leads, or SALs, are leads that sales agrees are worth working.
Why it matters:
SAL is the first serious alignment checkpoint between marketing and sales.
If MQLs are high but SALs are low, the problem may be:
- Weak scoring
- Poor ICP fit
- Bad routing
- Missing contact data
- Sales distrust
- Unclear qualification criteria
The fix:
Define exactly what sales must accept, reject, or recycle.
9. Sales qualified leads
Sales qualified leads, or SQLs, are leads that sales has qualified as legitimate potential opportunities.
SQL criteria may include:
- ICP fit
- Correct persona
- Business pain
- Buying influence
- Timing
- Need
- Budget path
- Clear next step
Why it matters:
SQLs are one of the most important B2B lead generation KPIs because they show whether lead generation is producing commercially relevant conversations.
Many B2B funnel benchmarks identify MQL-to-SQL as a major bottleneck, with one 2025 SaaS benchmark analysis reporting average MQL-to-SQL conversion around 15% to 21%. Use benchmarks carefully, but the directional lesson is clear: the handoff from marketing interest to sales qualification is often where funnel quality breaks.
10. MQL-to-SQL conversion rate
MQL-to-SQL conversion rate measures the percentage of MQLs that become SQLs.
Formula:
MQL-to-SQL conversion rate = SQLs / MQLs x 100
Why it matters:
This is a quality metric, not just a conversion metric.
It tells you whether marketing is attracting leads that sales can qualify.
A weak MQL-to-SQL rate may indicate:
- Poor ICP alignment
- Bad lead scoring
- Weak sales follow-up
- Low-intent lead magnets
- Misleading campaign messaging
- Slow response time
This is one of the first metrics RevOps should inspect when marketing and sales disagree about lead quality.
11. Lead response time
Lead response time measures how quickly sales or SDRs follow up with a new lead.
Formula:
Lead response time = time from lead creation to first sales touch
Why it matters:
Fast response is especially important for demo requests, pricing inquiries, contact forms, and high-intent page conversions.
Slow response creates leakage.
The fix:
Use SLAs by lead type.
Example:
- Demo request: under 5 minutes if possible
- Contact form: same business day
- Webinar attendee: within 24 to 48 hours
- Low-intent download: nurture first
Sales operations guidance often treats lead response time as a leading indicator because it can influence future conversion rates before revenue data is visible.
12. Contact rate
Contact rate measures the percentage of leads or prospects that SDRs successfully reach.
Formula:
Contact rate = contacts reached / contacts attempted x 100
Why it matters:
This is a practical SDR metric.
Low contact rate may indicate:
- Bad phone data
- Weak email deliverability
- Wrong persona
- Poor timing
- Overloaded sequences
- Weak channel mix
The fix:
Break contact rate down by source, persona, channel, and list provider.
13. Positive reply rate
Positive reply rate measures the percentage of outbound or email recipients who respond with interest, relevance, or willingness to continue.
Formula:
Positive reply rate = positive replies / delivered messages x 100
Why it matters:
Reply rate alone can be noisy. Negative replies, unsubscribe requests, and “not interested” responses do not show demand.
Positive reply rate is a better indicator of message-market fit.
The fix:
Classify replies manually or with clear categories:
- Positive
- Referral
- Not now
- Not interested
- Wrong person
- Existing vendor
- Unsubscribe
- Out of office
14. Meeting booked rate
Meeting booked rate measures the percentage of leads or prospects that become booked meetings.
Formula:
Meeting booked rate = meetings booked / leads or prospects worked x 100
Why it matters:
This is useful for SDR and appointment setting performance.
But it can be abused.
If reps are measured only on booked meetings, they may lower qualification standards.
The fix:
Pair meeting booked rate with meeting held rate, SQL rate, and AE acceptance.
15. Meeting held rate
Meeting held rate measures the percentage of booked meetings that actually happen.
Formula:
Meeting held rate = meetings held / meetings booked x 100
Why it matters:
A high no-show rate signals weak buyer commitment, poor qualification, poor reminders, or low urgency.
Meeting held rate is often more useful than meetings booked because it filters out weak calendar conversions.
16. No-show rate
No-show rate measures the percentage of booked meetings where the prospect does not attend.
Formula:
No-show rate = no-shows / meetings booked x 100
Why it matters:
No-shows waste AE time and distort pipeline forecasts.
High no-show rate may indicate:
- Weak qualification
- Too much pressure in booking
- Low-intent prospects
- Poor confirmation process
- Long delay between booking and meeting
- No clear business reason for the meeting
The fix:
Send a short confirmation email that restates the business reason for the call.
17. SDR activity volume
SDR activity volume measures the number of outbound actions reps complete.
Examples:
- Calls
- Emails
- LinkedIn touches
- Voicemails
- Account research tasks
- Follow-ups
Why it matters:
Activity is necessary. It shows whether the team is executing.
But activity is not the outcome.
A high-activity SDR with poor SQL conversion may be working the wrong accounts, using weak messaging, or booking low-quality meetings.
The fix:
Use activity metrics as diagnostic inputs, not success metrics.
18. Connect-to-meeting rate
Connect-to-meeting rate measures how often live conversations turn into booked meetings.
Formula:
Connect-to-meeting rate = meetings booked / live conversations x 100
Why it matters:
This is one of the better SDR metrics for call effectiveness.
It helps diagnose:
- Talk track quality
- Objection handling
- ICP fit
- Persona relevance
- Call timing
- CTA strength
SDR performance discussions often highlight connect-to-meeting rate and qualified pipeline as stronger indicators than raw call volume because they connect rep effort to actual sales outcomes.
19. Lead-to-opportunity conversion rate
Lead-to-opportunity conversion rate measures the percentage of leads that become sales opportunities.
Formula:
Lead-to-opportunity conversion rate = opportunities created / total leads x 100
Why it matters:
This KPI connects lead generation to pipeline creation.
It is more useful than lead volume because it shows whether leads survive sales qualification.
The fix:
Analyze this by source, campaign, ICP segment, and persona.
20. Opportunity creation rate
Opportunity creation rate measures how many qualified sales opportunities are created from a source, campaign, or team over time.
Why it matters:
This is where lead generation starts to become pipeline.
A campaign that creates many MQLs but few opportunities may be generating interest, not buying intent.
21. Pipeline generated
Pipeline generated measures the total dollar value of opportunities created from lead generation efforts.
Formula:
Pipeline generated = sum of opportunity value created from source or campaign
Why it matters:
Pipeline generated is a core B2B pipeline KPI.
It connects marketing and SDR work to future revenue potential.
The risk:
Pipeline value can be inflated if opportunity amounts are unrealistic or early-stage qualification is loose.
The fix:
Track sales-accepted pipeline and stage progression.
22. Pipeline velocity
Pipeline velocity measures how quickly pipeline moves toward revenue.
Common formula:
Pipeline velocity = number of opportunities x average deal size x win rate / average sales cycle length
Why it matters:
Pipeline velocity combines volume, deal value, win rate, and sales cycle speed.
It helps teams understand whether lead generation is creating deals that move.
Pipeline velocity is frequently cited as a key B2B demand generation and sales operations metric because it connects funnel performance to revenue movement.
23. Win rate by source
Win rate by source measures the percentage of opportunities from each channel or campaign that close won.
Formula:
Win rate by source = closed-won deals from source / total opportunities from source x 100
Why it matters:
This shows which sources produce real customers, not just opportunities.
A source may create many opportunities but close poorly.
That can indicate:
- Weak fit
- Bad expectations
- Poor qualification
- Misaligned messaging
- Low buying urgency
24. Customer acquisition cost
Customer acquisition cost, or CAC, measures how much it costs to acquire a customer.
Formula:
CAC = total sales and marketing cost / new customers acquired
Why it matters:
CAC helps evaluate whether lead generation is economically sustainable.
For B2B teams, CAC should be reviewed by segment and channel where possible.
Do not only ask:
“What did the lead cost?”
Ask:
“What did the customer cost?”
25. Customer lifetime value to CAC ratio
LTV:CAC compares the value of a customer over time to the cost of acquiring that customer.
Formula:
LTV:CAC = customer lifetime value / customer acquisition cost
Why it matters:
This metric helps leadership understand whether lead generation is producing profitable growth.
A low CPL is irrelevant if those leads become low-retention, low-margin customers.
26. Revenue influenced or sourced
Revenue sourced measures revenue directly generated from a channel or campaign.
Revenue influenced measures revenue where a campaign contributed to the buyer journey, even if it was not the original source.
Why it matters:
B2B buying journeys are rarely linear.
A buyer may discover the brand through SEO, attend a webinar, engage with retargeting, reply to outbound, and then book a demo.
RevOps should define sourced and influenced revenue clearly so teams do not double-count or overclaim.
Lead generation KPI categories
Activity KPIs
Use these to measure execution.
Examples:
- Emails sent
- Calls made
- LinkedIn touches
- Accounts worked
- Follow-ups completed
Activity KPIs answer:
“Did the team do the work?”
They do not answer:
“Did the work create pipeline?”
Engagement KPIs
Use these to measure market response.
Examples:
- Website engagement
- Reply rate
- Positive reply rate
- Contact rate
- Meeting booked rate
Engagement KPIs answer:
“Is the market responding?”
Quality KPIs
Use these to measure fit and sales acceptance.
Examples:
- MQL-to-SQL conversion
- Meeting held rate
- AE acceptance
- SQL rate
- Lead-to-opportunity conversion
Quality KPIs answer:
“Are the right buyers engaging?”
Pipeline KPIs
Use these to measure commercial impact.
Examples:
- Opportunities created
- Pipeline generated
- Pipeline velocity
- Win rate
- Sales cycle length
Pipeline KPIs answer:
“Is lead generation creating sales opportunities?”
Revenue KPIs
Use these to measure business outcome.
Examples:
- Closed-won revenue
- CAC
- LTV:CAC
- Revenue sourced
- Revenue influenced
Revenue KPIs answer:
“Is lead generation profitable?”
The KPI hierarchy: what to prioritize
Not every team should focus on the same KPIs.
Early-stage startup
Focus on:
- Positive reply rate
- Discovery calls
- ICP response
- Message-market fit
- Sales conversations
- Pilot interest
Why:
You are still validating.
Scaling B2B SaaS company
Focus on:
- MQL-to-SQL rate
- SQL volume
- Opportunity creation
- Pipeline generated
- Sales cycle
- Win rate by source
Why:
You need repeatable pipeline.
Mature revenue team
Focus on:
- Pipeline velocity
- CAC
- LTV:CAC
- Revenue sourced
- Revenue influenced
- Forecast accuracy
- Segment profitability
Why:
You need efficient growth.
Common lead generation KPI mistakes
Mistake 1: Treating lead volume as success
Lead volume is easy to inflate.
The fix:
Pair leads generated with SQL rate and opportunity creation.
Mistake 2: Overvaluing MQLs
MQLs can be useful, but they are not revenue.
The fix:
Measure MQL-to-SQL conversion and sales acceptance.
Mistake 3: Ignoring no-shows
Booked meetings are not the same as held meetings.
The fix:
Track meeting held rate and no-show rate.
Mistake 4: Measuring SDRs only on activity
Activity is necessary but incomplete.
The fix:
Track connect-to-meeting rate, SQL rate, AE acceptance, and pipeline created.
Mistake 5: Not segmenting by source
Blended metrics hide performance differences.
The fix:
Break down KPIs by channel, campaign, persona, ICP segment, and SDR team.
Mistake 6: No closed-loop reporting
If marketing cannot see which leads become opportunities and revenue, optimization becomes guesswork.
The fix:
RevOps should connect source, campaign, lead stage, opportunity, and revenue data.
How RevOps should build a lead generation KPI dashboard
A strong dashboard should show the funnel from first touch to revenue.
Section 1: Acquisition
- Website visitors
- Traffic source
- Leads generated
- CPL
Section 2: Qualification
- MQLs
- MQL rate
- SALs
- SQLs
- MQL-to-SQL conversion
Section 3: Sales development
- SDR activity
- Contact rate
- Positive reply rate
- Meeting booked rate
- Meeting held rate
- No-show rate
Section 4: Pipeline
- Opportunities created
- Lead-to-opportunity rate
- Pipeline generated
- Pipeline velocity
- Win rate by source
Section 5: Revenue
- Closed-won revenue
- CAC
- LTV:CAC
- Revenue sourced
- Revenue influenced
The dashboard should make one thing clear:
Where is the funnel leaking, and what should we fix next?
Trust note: benchmarks are useful, but context matters
Benchmarks can help teams sanity-check performance, but they should not replace internal analysis.
A good MQL-to-SQL rate depends on:
- Industry
- ACV
- Sales cycle
- Lead source
- Offer type
- ICP maturity
- Qualification rules
- Channel mix
- Sales capacity
Use benchmarks as directional references. Use your own funnel data to make decisions.
Where LevelUp Leads fits
LevelUp Leads helps B2B teams build and measure lead generation systems that focus on qualified pipeline, not activity for its own sake.
That means tracking:
- ICP fit
- Message-market fit
- SDR performance
- Appointment quality
- SQL conversion
- AE acceptance
- Pipeline contribution
- Revenue impact
For outsourced SDR, appointment setting, and outbound campaigns, the right KPI system prevents the most common failure: confusing a full calendar with a healthy pipeline.
Conclusion: lead generation KPIs should measure pipeline quality
The best lead generation KPIs do not just show whether marketing and SDR teams are busy.
They show whether the business is creating qualified demand, converting it into pipeline, and turning that pipeline into revenue.
Start with the basics:
- Leads generated
- MQLs
- SQLs
- Meetings held
- Opportunities created
- Pipeline generated
- Win rate
- CAC
- Revenue
Then go deeper:
- Source quality
- Positive reply rate
- AE acceptance
- No-show rate
- Pipeline velocity
- LTV:CAC
The goal is not a bigger dashboard.
The goal is better decisions.
LevelUP Leads
If your team is generating leads but still struggling with low SQL conversion, weak meeting quality, or unclear pipeline impact, LevelUp Leads can help review the full lead generation funnel.
A useful starting point is a KPI and pipeline quality audit: which metrics matter, where the funnel is leaking, and what should be fixed before increasing volume.
FAQ
Lead generation KPIs are metrics that measure how effectively a company attracts, qualifies, and converts leads into sales opportunities and revenue.